Annotations
Annotations are a concept which ‘annotate’ or ‘flag’ a datapoint in a timeseries.
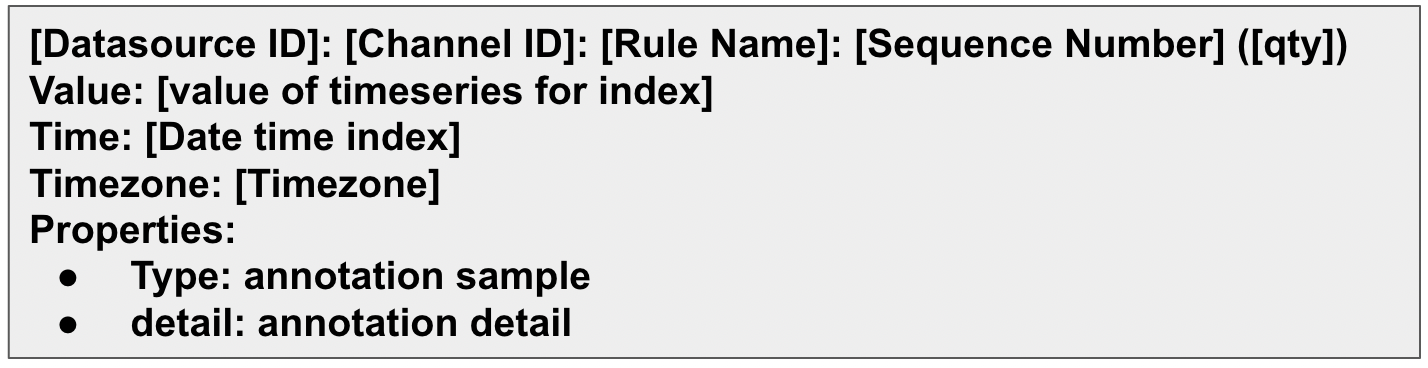
Annotations are shown on the platform chart following this pattern:
They help visualizing metadata like events in a given point in time. An example of annotations in a chart is shown in the image below.
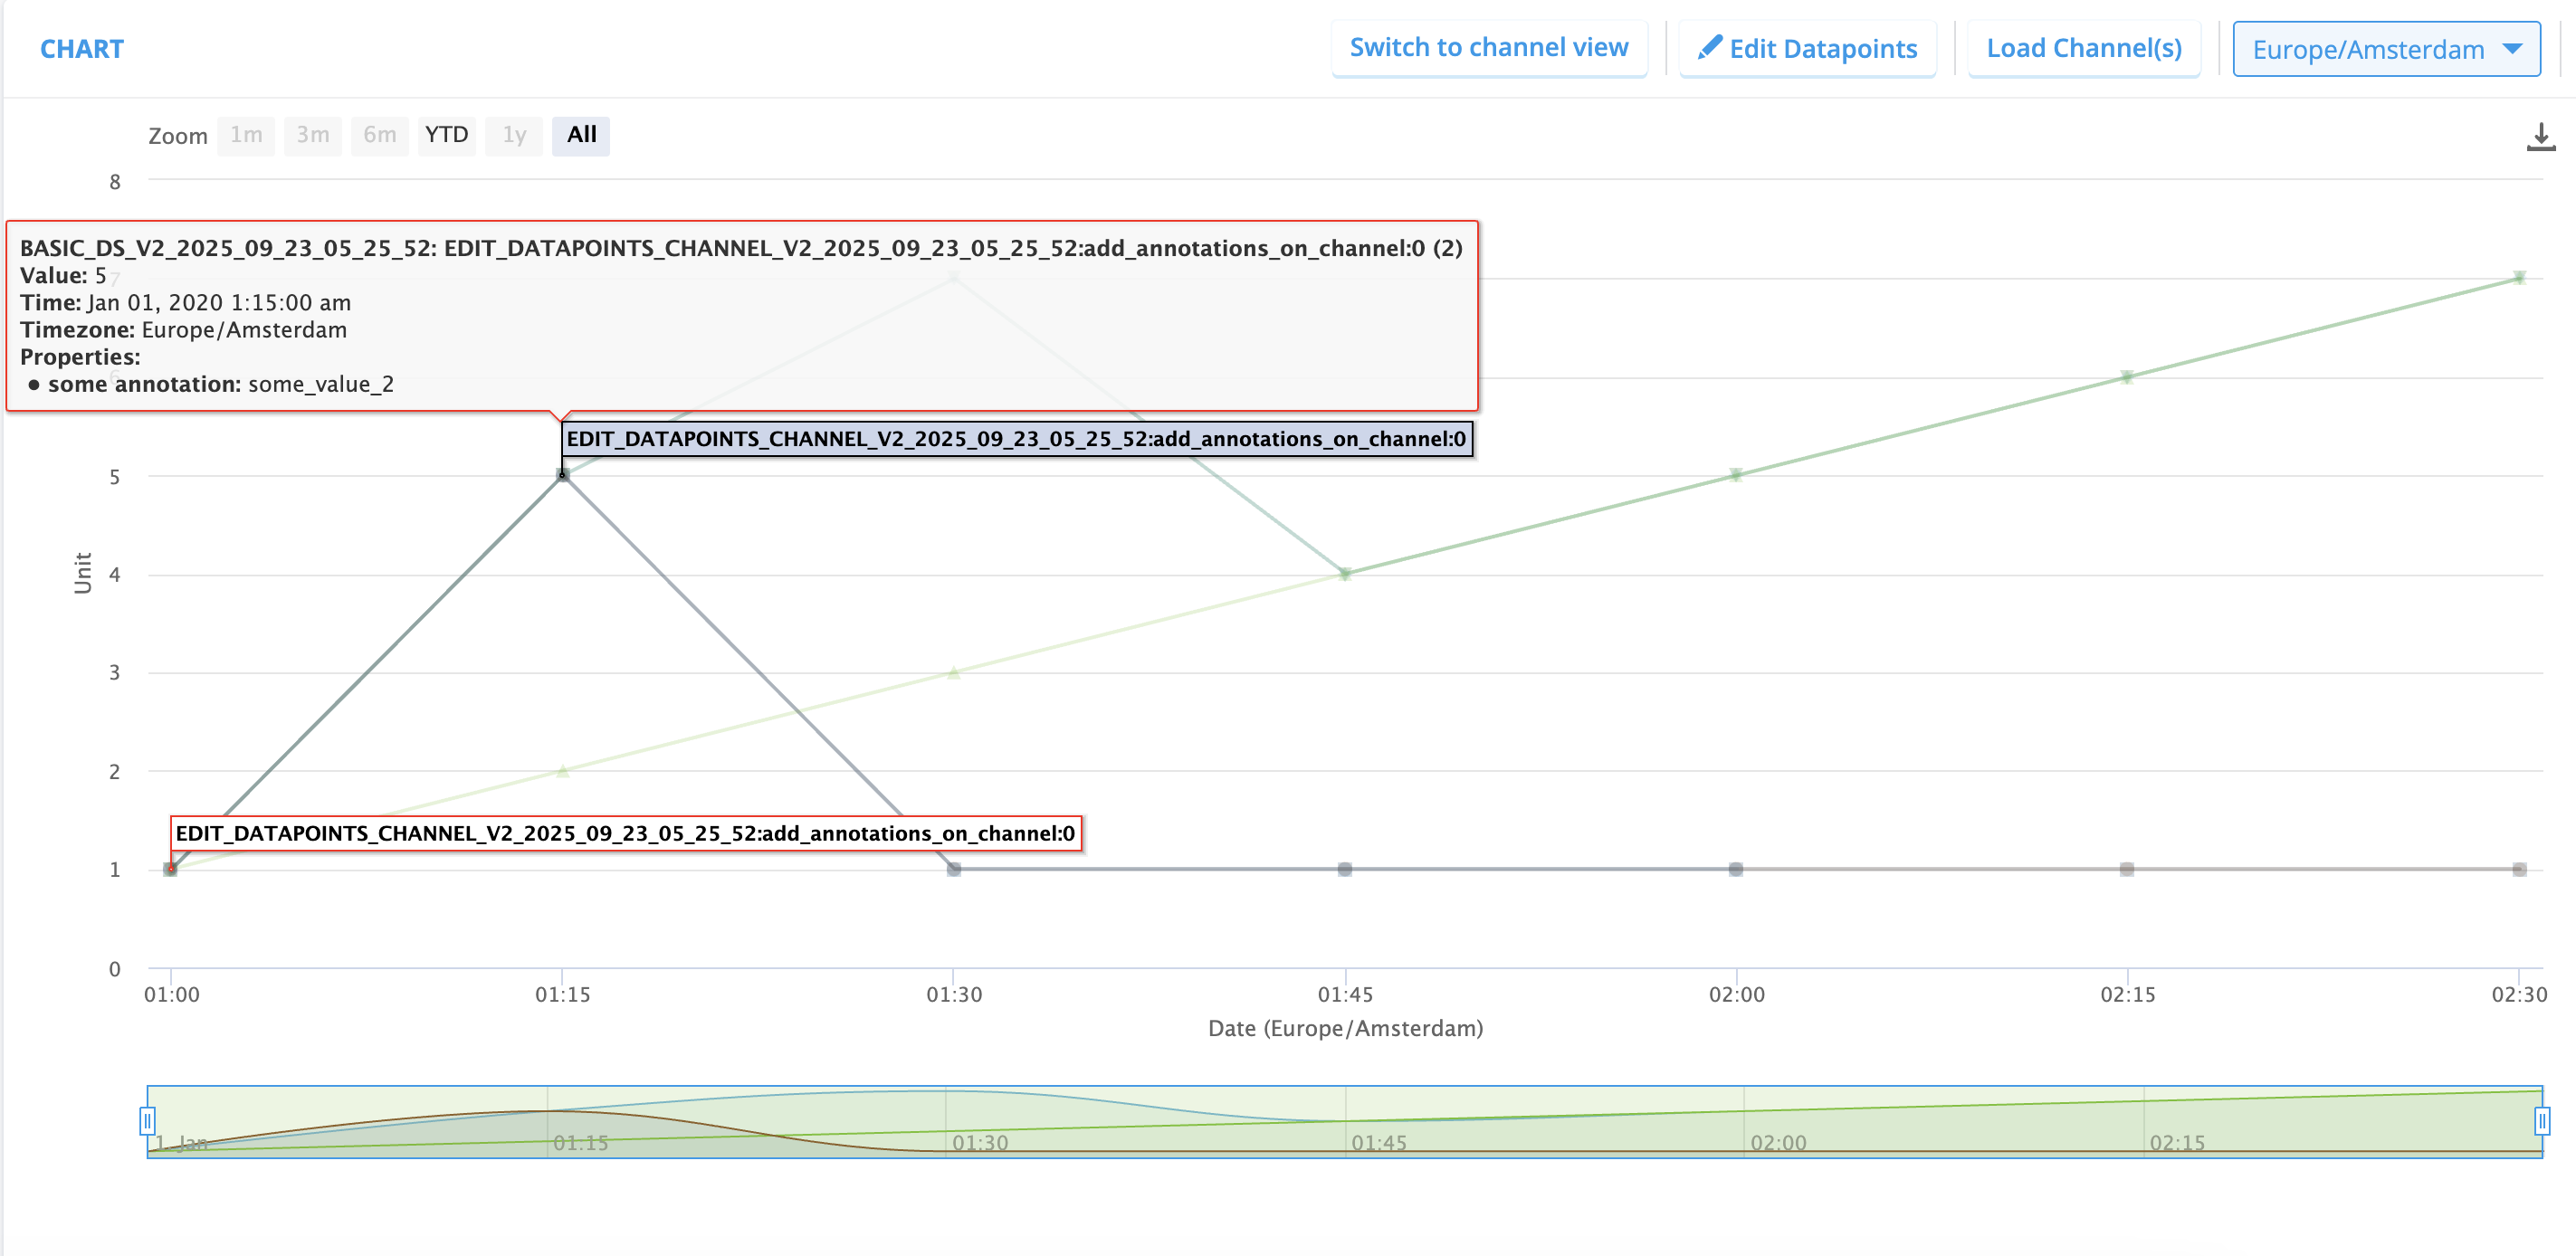 By hovering on a specific datapoint with annotations one can view the metadata of that datapoint.
See more technical information in Storing Timeseries from Rules